The Laptop Map 2026: The Best and Worst Coffee Cities for Working From a Café
We scored 80 cities on how their specialty cafés treat laptop workers: welcome, hours, and space, using 6,992 curated cafés. The famous coffee capitals still finish last.

Updated September 2026. Original cut: 16 August 2026.
Here is the most uncomfortable finding in our State of Specialty Coffee 2026 report: the world's most celebrated coffee cities are still among the worst places to work from a café.
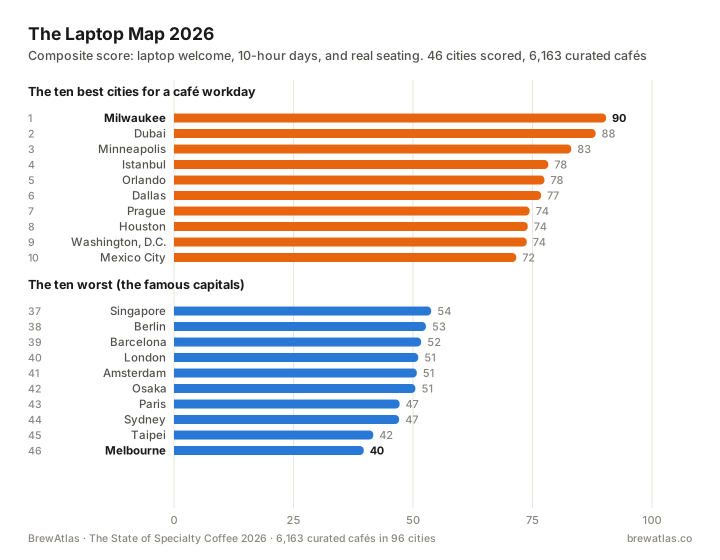
Melbourne, the spiritual home of the flat white, ranks dead last of the 80 cities we scored, and it is also the least laptop-welcoming city in the set (60.7%). Taipei is 79th, Sydney 78th, London 77th, Osaka 76th, Dublin 75th, Amsterdam 74th, Edinburgh 73rd, and Honolulu 72nd. The cities that taught the world to take coffee seriously would very much like you to drink it, enjoy it, and leave.
The best laptop cities? Milwaukee. Belgrade. Warsaw.
How we scored it
For every city clearing the sample gates (80 qualified on this cut), we measured three things across our curated café catalog:
- Welcome: the share of cafés classified laptop-friendly. Do they want you working there?
- Time: the share open 10+ hours a day. Can you actually put in a workday?
- Space: the share with comfortable or spacious seating. Is there physically room?
A city's score is the simple average of the three. (Why not wifi? Because our wifi field failed a data-integrity check: 97.3% "yes" reads as a collection default, and we don't publish defaults. Full methodology below.)
Sample gates match the original report: 30+ cafés with a welcome classification, 30+ with known seating (excluding unsure), and 20+ with verified Wednesday hours.
The ranking
Every city links to our live, curated list of its remote-work-friendly cafés.
| # | City | Score | Welcome | 10h+ days | Space |
|---|---|---|---|---|---|
| 1 | Milwaukee 🇺🇸 | 89.7 | 98% | 81% | 90% |
| 2 | Belgrade 🇷🇸 | 88.2 | 98% | 93% | 73% |
| 3 | Warsaw 🇵🇱 | 88.1 | 100% | 84% | 80% |
| 4 | Louisville 🇺🇸 | 87.6 | 97% | 75% | 91% |
| 5 | Dubai 🇦🇪 | 85.8 | 95% | 84% | 79% |
| 6 | Istanbul 🇹🇷 | 82.7 | 96% | 87% | 65% |
| 7 | Minneapolis 🇺🇸 | 81.7 | 96% | 68% | 81% |
| 8 | Buenos Aires 🇦🇷 | 80.8 | 92% | 92% | 58% |
| 9 | Las Vegas 🇺🇸 | 80.2 | 100% | 62% | 78% |
| 10 | Sacramento 🇺🇸 | 79.9 | 96% | 58% | 86% |
| 11 | Prague 🇨🇿 | 78.8 | 94% | 80% | 63% |
| 12 | Copenhagen 🇩🇰 | 78.2 | 96% | 68% | 70% |
| 13 | Tampa-St. Petersburg 🇺🇸 | 78.1 | 95% | 60% | 80% |
| 14 | Charlotte 🇺🇸 | 77.8 | 96% | 57% | 80% |
| 15 | Orlando 🇺🇸 | 77.6 | 82% | 80% | 71% |
| 16 | Bali 🇮🇩 | 77.1 | 91% | 79% | 61% |
| 17 | Athens 🇬🇷 | 77 | 96% | 76% | 59% |
| 18 | San Jose 🇺🇸 | 76.4 | 98% | 55% | 76% |
| 19 | Ho Chi Minh City 🇻🇳 | 76 | 91% | 75% | 62% |
| 20 | Dallas 🇺🇸 | 75.9 | 89% | 71% | 68% |
| 21 | New Orleans 🇺🇸 | 75.7 | 100% | 49% | 78% |
| 22 | Santa Barbara 🇺🇸 | 75.4 | 91% | 52% | 84% |
| 23 | Salt Lake City 🇺🇸 | 74.8 | 92% | 58% | 74% |
| 24 | Washington, D.C. 🇺🇸 | 74.8 | 93% | 68% | 63% |
| 25 | Rochester 🇺🇸 | 74.6 | 97% | 45% | 82% |
| 26 | Houston 🇺🇸 | 74 | 88% | 67% | 68% |
| 27 | Mexico City 🇲🇽 | 74 | 88% | 87% | 47% |
| 28 | Montreal 🇨🇦 | 72.8 | 97% | 51% | 71% |
| 29 | Seoul 🇰🇷 | 72.1 | 89% | 72% | 55% |
| 30 | São Paulo 🇧🇷 | 71.9 | 94% | 58% | 64% |
| 31 | Madrid 🇪🇸 | 71.8 | 96% | 76% | 43% |
| 32 | Atlanta 🇺🇸 | 71.7 | 91% | 59% | 65% |
| 33 | Kuala Lumpur 🇲🇾 | 71.5 | 85% | 71% | 59% |
| 34 | Phoenix 🇺🇸 | 71.4 | 85% | 60% | 69% |
| 35 | Miami 🇺🇸 | 71.3 | 89% | 64% | 61% |
| 36 | Vancouver 🇨🇦 | 69.6 | 91% | 67% | 50% |
| 37 | Nashville 🇺🇸 | 69.4 | 90% | 53% | 65% |
| 38 | Pittsburgh 🇺🇸 | 69.2 | 94% | 46% | 67% |
| 39 | Baltimore 🇺🇸 | 69.1 | 94% | 38% | 76% |
| 40 | Budapest 🇭🇺 | 69.1 | 91% | 61% | 55% |
| 41 | Chicago 🇺🇸 | 69.1 | 88% | 57% | 62% |
| 42 | Austin 🇺🇸 | 68.7 | 77% | 62% | 67% |
| 43 | San Antonio 🇺🇸 | 67.8 | 84% | 54% | 66% |
| 44 | Asheville 🇺🇸 | 67.7 | 87% | 48% | 68% |
| 45 | Philadelphia 🇺🇸 | 67.2 | 91% | 44% | 67% |
| 46 | Toronto 🇨🇦 | 67.2 | 88% | 58% | 55% |
| 47 | San Diego 🇺🇸 | 66.3 | 92% | 48% | 58% |
| 48 | Zurich 🇨🇭 | 66.3 | 90% | 54% | 55% |
| 49 | Hong Kong 🇭🇰 | 65.8 | 89% | 67% | 42% |
| 50 | New York 🇺🇸 | 65.5 | 74% | 74% | 48% |
| 51 | Seattle 🇺🇸 | 65.5 | 93% | 61% | 42% | | 52 | Rome 🇮🇹 | 65.2 | 94% | 50% | 52% | | 53 | Denver 🇺🇸 | 63.9 | 88% | 45% | 59% | | 54 | Portland 🇺🇸 | 63.4 | 92% | 38% | 60% | | 55 | Tokyo 🇯🇵 | 63 | 82% | 61% | 46% | | 56 | Porto 🇵🇹 | 62.3 | 97% | 23% | 67% | | 57 | Los Angeles 🇺🇸 | 61.9 | 79% | 56% | 51% | | 58 | Boston 🇺🇸 | 61.1 | 83% | 53% | 47% | | 59 | Bangkok 🇹🇭 | 60.7 | 87% | 51% | 44% | | 60 | San Francisco 🇺🇸 | 60.3 | 71% | 58% | 51% | | 61 | Lisbon 🇵🇹 | 60.1 | 93% | 30% | 57% | | 62 | Vienna 🇦🇹 | 59.7 | 82% | 49% | 49% | | 63 | Oakland 🇺🇸 | 57.1 | 86% | 26% | 60% | | 64 | Kyoto 🇯🇵 | 57 | 82% | 49% | 40% | | 65 | Manchester 🇬🇧 | 56.7 | 91% | 17% | 62% | | 66 | Paris 🇫🇷 | 56.7 | 94% | 36% | 39% | | 67 | Bristol 🇬🇧 | 56.6 | 94% | 16% | 60% | | 68 | Berlin 🇩🇪 | 56.1 | 74% | 45% | 50% | | 69 | Barcelona 🇪🇸 | 55.7 | 67% | 66% | 33% | | 70 | Auckland 🇳🇿 | 54.9 | 94% | 6% | 66% | | 71 | Singapore 🇸🇬 | 54.9 | 84% | 33% | 47% | | 72 | Honolulu 🇺🇸 | 53.8 | 77% | 26% | 58% | | 73 | Edinburgh 🇬🇧 | 53.7 | 90% | 24% | 47% | | 74 | Amsterdam 🇳🇱 | 52.9 | 82% | 27% | 50% | | 75 | Dublin 🇮🇪 | 51.9 | 92% | 13% | 51% | | 76 | Osaka 🇯🇵 | 51.8 | 77% | 42% | 37% | | 77 | London 🇬🇧 | 51.2 | 82% | 30% | 41% | | 78 | Sydney 🇦🇺 | 49.9 | 87% | 14% | 48% | | 79 | Taipei 🇹🇼 | 41.1 | 74% | 18% | 32% | | 80 | Melbourne 🇦🇺 | 40 | 61% | 13% | 46% |
Why the coffee capitals lost
Each one fails a different way, and each failure is a cultural signature, not an accident.
Australia fails on hours. Only 14.5% of Sydney's cafés and 13.2% of Melbourne's are open 10+ hours a day, among the lowest figures we measured (median day: about 8 hours). Australian café culture is brunch culture: table service, food-led, and done by mid-afternoon. Half of Melbourne's specialty cafés are closed by 3:30pm (local time). You cannot work a workday from a café that ends before your standup.
Southern Europe and Australia fail on welcome. Melbourne posts the lowest laptop-welcome share in the scored set, 60.7%, with Barcelona at 67.3%, against a global open-catalog average of 87.9%. San Francisco (71.3%), New York (74.2%), Berlin (73.6%), and Taipei (73.7%) complete a familiar bottom tier: exactly the cities where the anti-laptop backlash, from banned-laptop cafés to weekend laptop bans to "no laptops after 12" signs, has been loudest. Our data suggests the discourse isn't noise; it's policy.
Paris welcomes laptops but is not a seating standout. Paris still welcomes laptops (94.4%, among the higher scores anywhere). After seating was backfilled across the catalog, about 39% of Paris cafés with known seating read as comfortable or spacious. That is middling, and Paris still sits in the lower third of the composite ranking (66th) on short days and middling space. The August seating extreme, based on partial coverage, no longer holds.
Who actually wants you there
- India remains one of the most laptop-welcoming coffee countries on Earth: 98.1% of its specialty cafés are work-friendly (Delhi: 100%), and its cafés run among the longest days anywhere. In Mumbai, the median café is open 14.5 hours a day, and 92.3% clear the 10-hour bar. Pair that with 11pm median closes and you get the full picture from our main report: the world's hardest-working cafés are Indian.
- Poland and Serbia punch above their press. Warsaw (#3) is 100% welcoming on our classification, and Belgrade (#2) pairs a 98.3% welcome rate with 93.3% of cafés clearing a 10-hour day.
- The American Midwest is still the laptop paradise nobody talks about. Milwaukee (#1) and Louisville (#4) win on space: about 90% and 91% comfortable or spacious. The roomiest specialty cafés in the scored set are not in Brooklyn or Shoreditch; they are in Wisconsin and Kentucky.
- Dubai remains elite across dimensions: about 95% welcoming, long days (about 84% clear 10 hours), and about 79% spacious. It is the same city our main report treats as one of the world's densest late-night specialty markets.
- Mexico City is a long-day peer: 87.4% of its cafés clear a 10-hour day, matching Istanbul, even if tighter seating keeps the composite mid-pack (#27).
The country league table (welcome %)
Most laptop-welcoming among larger samples: Poland 100%, Serbia 98.7%, India 98.1%, South Africa 97.2%, Norway 96.8%, Greece 96.3%, Denmark 96.3%, Turkey 95.5%, UAE 94.8%, and France 94.4%. Least: Germany 73.6%, Australia 73.7%, Taiwan 73.7%, Spain 79.4%, and Japan 80.9%, with everyone else mostly in the 82-94% band. The anti-laptop belt still runs through Germany, East Asia, Iberia, and Australia.
Methodology and honesty notes
Data: 6,992 currently open cafés in BrewAtlas's curated specialty directory across 116 live cities in 39 countries (verified status, excluding closed and temporarily closed), computed September 21, 2026. This ranking covers the 80 cities clearing minimum sample sizes on all three dimensions (30+ cafés classified for welcome, 30+ with known seating excluding unsure, and 20+ with verified Wednesday hours). "Welcome" is our binary work-friendly classification made at curation time. "Time" uses verified Google Places hours: the share open 10 or more hours on a typical Wednesday, local time, with overnight closes normalized into the same service day. "Space" is the share of cafés with known seating classified comfortable or spacious (98.7% of the open catalog now has a known seating class after backfill). The composite is an unweighted mean of the three shares. No secret sauce: argue with the weights all you like, and the per-dimension columns above let you re-rank by what you care about. We deliberately excluded our wifi field (97.3% "yes" reads as a collection default, not signal) and publish no wifi claims. Cities below the sample gates appear in related dimension figures in the main report but not this composite ranking. Chart images under the August asset paths may lag until regenerated; the table and prose here are authoritative for September 2026. The full dataset is available to journalists and researchers on request: sheldon@brewatlas.info.
Every city above links to our live, curated list of remote-work-friendly cafés there: the working version of this data. From The State of Specialty Coffee 2026 by BrewAtlas.
Frequently Asked Questions
Written by
Sheldon Bishop
Founder, BrewAtlas
I built BrewAtlas to map the specialty coffee worth crossing a city for. I spend my time visiting roasters and cafés around the world and writing up what is actually worth your morning.


